Production businesses
in the archive
This page is no longer updated by Screen Australia
Number of projects and estimated total value of production budgets raised through 10BA, according to type of project, 1980/81–2006/07
All types | Features | TV drama | Documentary
All types
Source: Department of Communications, Information Technology and the Arts, Commonwealth Treasury, Department of Water, Heritage, Environment and the Arts.
![Top]()
Features
|
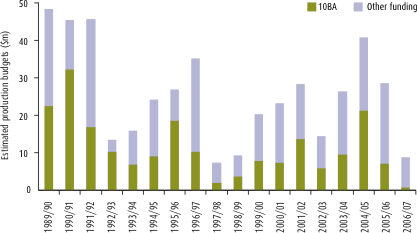
Proportion of total feature production budgets raised through 10BA tax incentives
|
Source: Department of Communications, Information Technology and the Arts, Commonwealth Treasury, Department of Water, Heritage, Environment and the Arts.
![Top]()
TV drama
Proportion of total TV drama production budgets raised through 10BA tax incentives
Telemovies
Source: Department of Communications, Information Technology and the Arts, Commonwealth Treasury, Department of Water, Heritage, Environment and the Arts.
![Top]()
Mini-series
Source: Department of Communications, Information Technology and the Arts, Commonwealth Treasury. Department of Water, Heritage, Environment and the Arts.
![Top]()
Documentary
Proportion of total documentary production budgets raised through 10BA tax incentives
Source: Department of Communications, Information Technology and the Arts, Commonwealth Treasury, Department of Water, Heritage, Environment and the Arts.
![Top]()